Random_genesis

- Scientific worldbuilding
Constructing fictional places has always been one of the main goals in the general field of procedural generation.
However, in most cases, even the generation of entire worlds has just been a necessary step in the creation of some other product. The generation tends therefore to focus on a few aspects that are core to the final product, while many variables are left aside.
The idea is to try and create large territories, where many different variables are scientifcally taken into account: geology, geography, climate, ecology...
Possibly, through the application of some "Guns, Germs and Steel-like" mechanics it will be possible to simulate large scale interactions between humans and the environment, and among humans on a large scale.
Climate step 1: Temperatures (Mar 2018)
>Previous Update
I am not interesting in climate simulation per se. The goal here is to build a convincing environment as a base for simulating long term human-environment interactions.
The system should be able to meaningfully calculate mean temperature and humidity in order to distribute biomes, and also define the prevailing winds, necessary for seasonal climatic events such as monsoons and floodings, as well as for navigation routes.
Temperatures on Earth are mostly determined by thermal energy coming from the sun. Since the Earth is round, solar radiations impact the ground at an angle, depending on the latitude.
Also, since the Earth rotates around an axis that is tilted, during the year the angle between Earth's axis and the imaginary line connecting Earth and the sun changes, determining seasons.
Now, since the map I am working on is flat rather than round, latitude will vary linearly along the y axis of the map, rather than as an angle on a circumference.
This is like squashing a cylinder into a rectangle, it has the effect of showing distances without the deformation we are used to in maps.
The first step is to define how latitude is tied to temperature. It is also important to note that land and ocean heat/cool differently:
the different heat capacities (plus other factors) of water and solid ground make it so that land temperatures vary more and more quickly, while the ocean oscillates more moderately.
There is a lot of material online that could be used to define a latitude-temperature function, but most of it is either over-complicated or over-simplified. Obtaining a meaningful approximation without digging through huge amounts of poorly presented and poorly documented data proved to be harder than expected, especially since its almost never clear whether the data refer to land or sea or both.
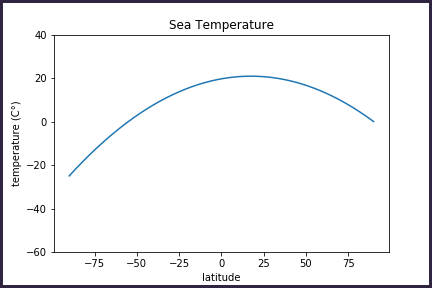
I decided to approximate the curve with a parabola, which empyrically looked "similar enough" to most curves found online.
In order to define it, it is necessary to pin at least 3 points. The most meaningful points are of course the temperature at the equator, and that at the poles.
Very handily, the South Pole is on land while the North Pole is on water. This means that we can use one to define the curve for solid ground and the other one for ocean.
The data i found (from a NASA webpage) show that the temperatures in the middle of Antarctica, at sea level, vary from around -60 during winter, to +5 in summer. Since naturally it is always winter in one emisphere when it's summer in the other, these two values define the temperature values at latitudes 90 and -90 in the latitude-temperature curve for land.
The temperatures at the Equator only vary very slightly of course, remaining always around 30-37 degrees C.
On water, temperatures at the poles vary between 0 and -25 (this is not the temeprature OF the water, but rather the temperature at the surface), while at the Equator remain in the range (20-25C).
With a little bit of algebra, it is immediate to define the associated curves fitting the 3 points (at the height of summer in the Northern emisphere).

Assuming the curve to be acceptable (it will be easier to come back to it and tweak it later), the next logical step is to model the effect of seasonal changes in the relative direction of the sun.
The curve describes the latitude-temperature function at the peak of summer in the Northern emisphere. In order to obtain the winter curve it is sufficient to "mirror" the curve around the y axis. This can easily be achieved by finding the axis of symmetry of our curve, and shifting it all to the other side of the Y axis.
The distance between the axis of symmetry during summer and that of the winter curve is then the 6-monthly shift of the sun in terms of latitude, between the two solstices. In turn this allows us to obtain the monthly shift by dividing it by 6.
In the case of the land temperature curve, the axis of symmetry during summer (northern emisphere) is at +25 degrees of latitude. This means that at the winter solstice, 6 months later, it will be at -25 degrees. Therefore the monthly shift is of 50/6=8.33 degrees of latitude.
This is the resulting set of curves describing different temperature-latitude functions in different months of the year.
Excluding the two extremes, each curve describes two months: one in winter/spring and one in summer/autumn.
The whole system is stored at the price of 3 variables for the curve, plus one for the monthly shift.

Before looking into other factors, altitude above sea level has obviously a strong impact on the mean temperature of a given area. Temperatures drop at a constant rate of about 9.8C per thousand meters of altitude. Also shallow water tends to be warmer than deep water, because it lacks the moderating power of convection currents. This is easily modeled.
After these calculations, the matrix storing temperature values is smoothed slightly, to account for local-scale heat transfer.
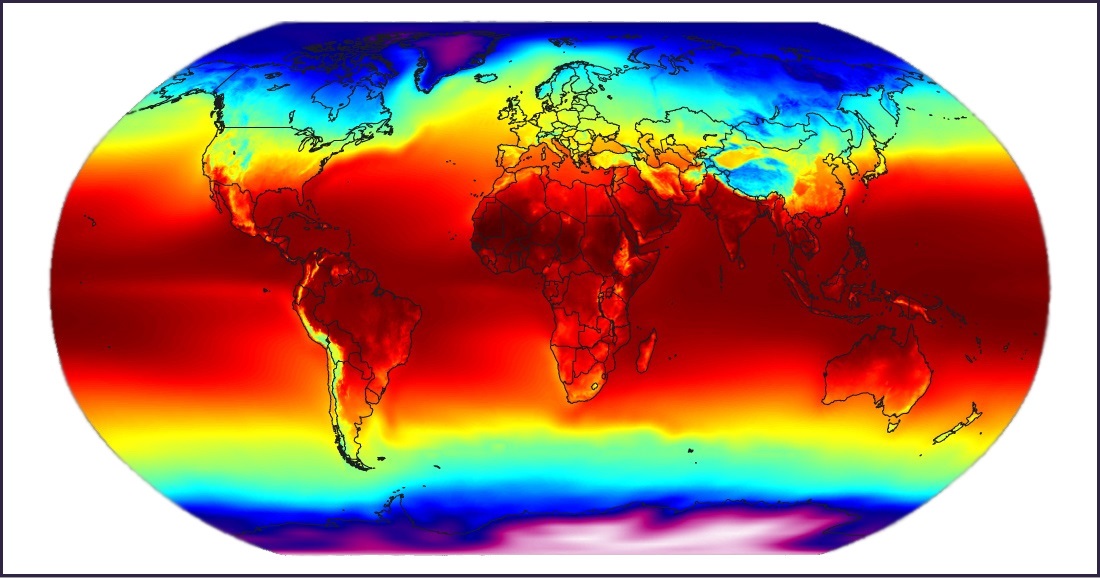
This is how temperatures look like with the current system. Unlike most real-world temperature maps, land and sea are coloured according to the same scale.

Having a basic temperature system in place makes it possible to start working on other derived stuff, for instance ice/snow covering land at the appropriate time of the year.
Later this will (ideally) have an influence on a number of things, but for now its basically just to see how it looks.
I can already see a problem: the ice tends to form an ugly straight-ish white line on the sea, while in reality it tends to bunch up along
coastilines and fill every gulf and bay.
This is due to the fact that real ice in open waters forms less easily and breaks down more quickly due to milder water temperatures and stronger waves.
What i did here was just setting a simple "if temperature below X, then ice" rule.
Real ice doesn't immediately form or immediately melt as soon as the temperatures pass a certain threshold. Real ice can even form in one place and then be moved around by winds and currents.
Of course none of this is modeled as yet, and that's why it looks terrible.
Also, it looks like there is "too much ice". part of it is the abovementioned simplicity of the model behind it, but this is also due to the fact that this map is flat, and therefore areas at extreme latitudes are not compressed like in real world maps.